Single Script to Modify Graphs
The Digital Garden plugin offers a similar graph feature to Obsidian, showing all connected pages to the current page out to different layers. By default, all linked pages are the same color, and index pages can overshadow more helpful links.
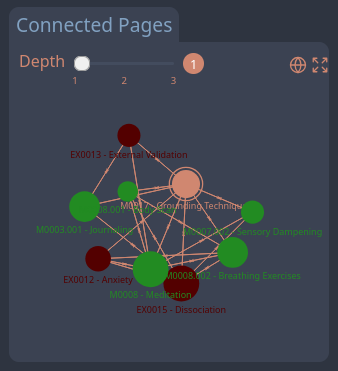
Table of Contents
How to add coloration to the graph
- Replace the contents of the graphScript.njk at
src/site/_includes/components/graphScript.njkwith the code below. - There are two sections commented
**User Start**that mark where you should make changes.- The first section is to identify files or folders you wish to exclude from the graph (like index files or home pages)
- The second section is where you make color choices based on folders.
- Excluding files and folders
- Use commas to separate files
- e.g.,
['/about-adhd-bamf', '/']
- e.g.,
- Make sure that the paths match the URL.
- If you exclude a folder, you do not need to also exclude any pages it contains.
- Use commas to separate files
- Colorizing nodes based on folder
- To colorize specific folders, add the folder name to the list, and use the hex-value for the color you want.
- Like when excluding folders, make sure that the folders match the URL (e.g.,
/expressionsinstead of “Expressions”). - You can search for hex codes, or use sites like ColorsWall to find hex codes for the colors you want.
- Like when excluding folders, make sure that the folders match the URL (e.g.,
- To colorize specific folders, add the folder name to the list, and use the hex-value for the color you want.
- Save and commit changes.
- Profit!
Production-ready script
<script>
    async function fetchGraphData() {
        const graphData = await fetch('/graph.json').then(res => res.json());
        const fullGraphData  = filterFullGraphData(graphData);
        return {graphData, fullGraphData}
    }

    function getNextLevelNeighbours(existing, remaining) {
        const keys = Object.values(existing).map((n) => n.neighbors).flat();
        const n_remaining = Object.keys(remaining).reduce((acc, key) => {
                if (keys.indexOf(key) != -1) {
                    if (!remaining[key].hide) {
                        existing[key] = remaining[key];
                    }
                } else {
                    acc[key] = remaining[key];
                }
                return acc;
            }, {});
        return existing, n_remaining;
    }

    function filterLocalGraphData(graphData, depth) {
        if (graphData == null) {
            return null;
        }

        let remaining = JSON.parse(JSON.stringify(graphData.nodes));
        let links = JSON.parse(JSON.stringify(graphData.links));
        let currentLink = decodeURI(window.location.pathname);
        let currentNode = remaining[currentLink] || Object.values(remaining).find((v) => v.home);

        delete remaining[currentNode.url];
        if (!currentNode.home) {
            let home = Object.values(remaining).find((v) => v.home);
            delete remaining[home.url];
        }
        currentNode.current = true;
        let existing = {};
        existing[currentNode.url] = currentNode;
        for (let i = 0; i < depth; i++) {
            existing, remaining = getNextLevelNeighbours(existing, remaining);
        }

        // **Modification Start**: Filter nodes based on folders or files with decoded URLs
	    // **User Start**: Enter folder and file paths to exclude
        const foldersToExclude = ['/project-management/']; // Use the URL folder path
        const filesToExclude = ['/about-adhd-bamf', '/']; // Use the full URL file path
		// **User End**

        nodes = Object.values(existing).filter(n => {
            const nodeUrl = decodeURIComponent(n.url);

            // Exclude nodes in specified folders
            // Exclude specified files
            const isExcludedFile = filesToExclude.includes(nodeUrl);
            const shouldHide = n.hide || inExcludedFolder || isExcludedFile;

            return !shouldHide;
        });

        // **Modification End**

        if (!currentNode.home) {
            nodes = nodes.filter(n => !n.home);
        }
        let ids = nodes.map((n) => n.id);

        return {
            nodes,
            links: links.filter(function (con) {
                const includeLink = ids.indexOf(con.target) > -1 && ids.indexOf(con.source) > -1;
                return includeLink;
            }),
        }
    }

    function getCssVar(variable) { return getComputedStyle(document.body).getPropertyValue(variable) }

    function htmlDecode(input) {
        var doc = new DOMParser().parseFromString(input, "text/html");
        return doc.documentElement.textContent;
    }

    function renderGraph(graphData, id, delay, fullScreen) {
        if (graphData == null) {
            return;
        }
        const el = document.getElementById(id);
        width = el.offsetWidth;
        height = el.offsetHeight;
        const highlightNodes = new Set();
        let hoverNode = null;

        // **Modification Start**: Define specific colors for folders
        // **User Start**: Enter folder and color pairings
        const folderColorMap = {
            '/expressions': '#530000',    // Red
            '/mitigations': '#228B22',    // Green
            '/definitions': '#808080',    // Gray
            // Add more folders and colors as needed
        };

        // Default color palette for folders not specified
        const defaultColorPalette = ['#f58231', '#911eb4', '#46f0f0',
                                     '#f032e6', '#bcf60c', '#fabebe', '#008080',
                                     '#e6beff', '#9a6324', '#fffac8', '#800000',
                                     '#aaffc3', '#808000', '#ffd8b1', '#000075',
                                     '#808080'];
		// **User End**

        let defaultColorIndex = 0;

        function getNodeColor(node) {
            if (node.current) {
                return getCssVar("--graph-main");
            }
            const nodeUrl = decodeURIComponent(node.url);
            const folderMatch = nodeUrl.match(/^\/[^/]+/);
            const folder = folderMatch ? folderMatch[0] : '/';
            // Check if folder has a specified color
            if (folderColorMap[folder]) {
                return folderColorMap[folder];
            } else {
                // Assign a default color if not specified
                if (!folderColorMap[folder]) {
                    folderColorMap[folder] = defaultColorPalette[defaultColorIndex % defaultColorPalette.length];
                    defaultColorIndex++;
                }
                return folderColorMap[folder];
            }
        }
        // **Modification End**

        let Graph = ForceGraph()
        (el)
            .graphData(graphData)
            .nodeId('id')
            .nodeLabel('title')
            .linkSource('source')
            .linkTarget('target')
            .d3AlphaDecay(0.10)
            .width(width)
            .height(height)
            .linkDirectionalArrowLength(2)
            .linkDirectionalArrowRelPos(0.5)
            .autoPauseRedraw(false)
            .linkColor((link) => {
                if (hoverNode == null) {
                    return getCssVar("--graph-main");
                }
                if (link.source.id == hoverNode.id || link.target.id == hoverNode.id) {
                    return getCssVar("--graph-main");
                } else {
                    return getCssVar("--graph-muted");
                }
            })
            .nodeCanvasObject((node, ctx) => {
                const numberOfNeighbours = (node.neighbors && node.neighbors.length) || 2;
                const nodeR = Math.min(7, Math.max(numberOfNeighbours / 2, 2));

                ctx.beginPath();
                ctx.arc(node.x, node.y, nodeR, 0, 2 * Math.PI, false);

                // **Modification Start**: Use getNodeColor function
                let nodeColor = getNodeColor(node);

                if (hoverNode == null) {
                    ctx.fillStyle = nodeColor;
                } else {
                    if (node == hoverNode || highlightNodes.has(node.url)) {
                        ctx.fillStyle = nodeColor;
                    } else {
                        ctx.fillStyle = getCssVar("--graph-muted");
                    }
                }
                // **Modification End**

                ctx.fill();

                if (node.current) {
                    ctx.beginPath();
                    ctx.arc(node.x, node.y, nodeR + 1, 0, 2 * Math.PI, false);
                    ctx.lineWidth = 0.5;
                    ctx.strokeStyle = getCssVar("--graph-main");
                    ctx.stroke();
                }

                const label = htmlDecode(node.title)
                const fontSize = 3.5;
                ctx.font = `${fontSize}px Sans-Serif`;

                ctx.textAlign = 'center';
                ctx.textBaseline = 'top';
                ctx.fillText(label, node.x, node.y + nodeR + 2);
            })
            .onNodeClick(node => {
                window.location = node.url;
            })
            .onNodeHover(node => {
                highlightNodes.clear();
                if (node) {
                    highlightNodes.add(node);
                    node.neighbors.forEach(neighbor => highlightNodes.add(neighbor));
                }
                hoverNode = node || null;
            });
            if (fullScreen || (delay != null && graphData.nodes.length > 4)) {
                setTimeout(() => {
                    Graph.zoomToFit(5, 75);
                }, delay || 200);
            }
        return Graph;
    }

    function renderLocalGraph(graphData, depth, fullScreen) {
        if (window.graph){
            window.graph._destructor();
        }
        const data = filterLocalGraphData(graphData, depth);
        return renderGraph(data, 'link-graph', null, fullScreen);
    }

    function filterFullGraphData(graphData) {
        if (graphData == null) {
            return null;
        }

        graphData = JSON.parse(JSON.stringify(graphData));

        // **Modification Start**: Filter nodes based on folders or files with decoded URLs
        const foldersToExclude = ['/project-management/']; // Use the URL folder path
        const filesToExclude = ['/about-adhd-bamf', '/']; // Use the full URL file path

        // Filter out nodes in specified folders or files
        const hiddens = Object.values(graphData.nodes)
            .filter((n) => {
                const nodeUrl = decodeURIComponent(n.url);

                const inExcludedFolder = foldersToExclude.some(folder => nodeUrl.startsWith(folder));
                const isExcludedFile = filesToExclude.includes(nodeUrl);
                const shouldHide = n.hide || inExcludedFolder || isExcludedFile;

                return shouldHide;
            })
            .map((n) => n.id);

        const data = {
            links: graphData.links.filter((l) => {
                const includeLink = !hiddens.includes(l.source) && !hiddens.includes(l.target);
                return includeLink;
            }),
            nodes: Object.values(graphData.nodes).filter((n) => {
                const includeNode = !hiddens.includes(n.id);
                return includeNode;
            })
        };
        return data;
    }

    function openFullGraph(fullGraphData) {
        lucide.createIcons({
                attrs: {
                    class: ["svg-icon"]
                }
            });
        return renderGraph(fullGraphData, "full-graph-container", 200, false);;
    }

    function closefullGraph(fullGraph) {
        if (fullGraph) {
            fullGraph._destructor();
        }
        return null;
    }
</script>
<div  x-init="{graphData, fullGraphData} = await fetchGraphData();" x-data="{ graphData: null, depth: 1, graph: null, fullGraph: null, showFullGraph: false, fullScreen: false, fullGraphData: null}" id="graph-component" x-bind:class="fullScreen ? 'graph graph-fs' : 'graph'" v-scope>
    <div class="graph-title-container">
        <div class="graph-title">Connected Pages</div>
        <div id="graph-controls">
                <div class="depth-control">
                    <label for="graph-depth">Depth</label>
                    <div class="slider">
                            <input x-model.number="depth" name="graph-depth" list="depthmarkers" type="range" step="1" min="1" max="3" id="graph-depth"/>
                    <datalist id="depthmarkers">
                            <option value="1" label="1"></option>
                            <option value="2" label="2"></option>
                            <option value="3" label="3"></option>
                    </datalist>
                    </div>
                    <span id="depth-display" x-text="depth"></span>
                </div>
                <div class="ctrl-right">
                    <span id="global-graph-btn" x-on:click="showFullGraph = true; setTimeout(() => { fullGraph = openFullGraph(fullGraphData)}, 100)"><i  icon-name="globe" aria-hidden="true"></i></span>
                    <span  id="graph-fs-btn"  x-on:click="fullScreen = !fullScreen;"><i  icon-name="expand" aria-hidden="true"></i></span>
                </div>
        </div>
    </div>
    <div x-effect="window.graph = renderLocalGraph(graphData, depth, fullScreen);" id="link-graph" ></div>
    <div x-show="showFullGraph" id="full-graph" class="show" style="display: none;">
        <span id="full-graph-close" x-on:click="fullGraph = closefullGraph(fullGraph); showFullGraph = false;"><i icon-name="x" aria-hidden="true"></i></span><div id="full-graph-container"></div>
    </div>
</div>-
Note that you do not need to exclude both folder and file, this is just for demonstration purposes. ↩